
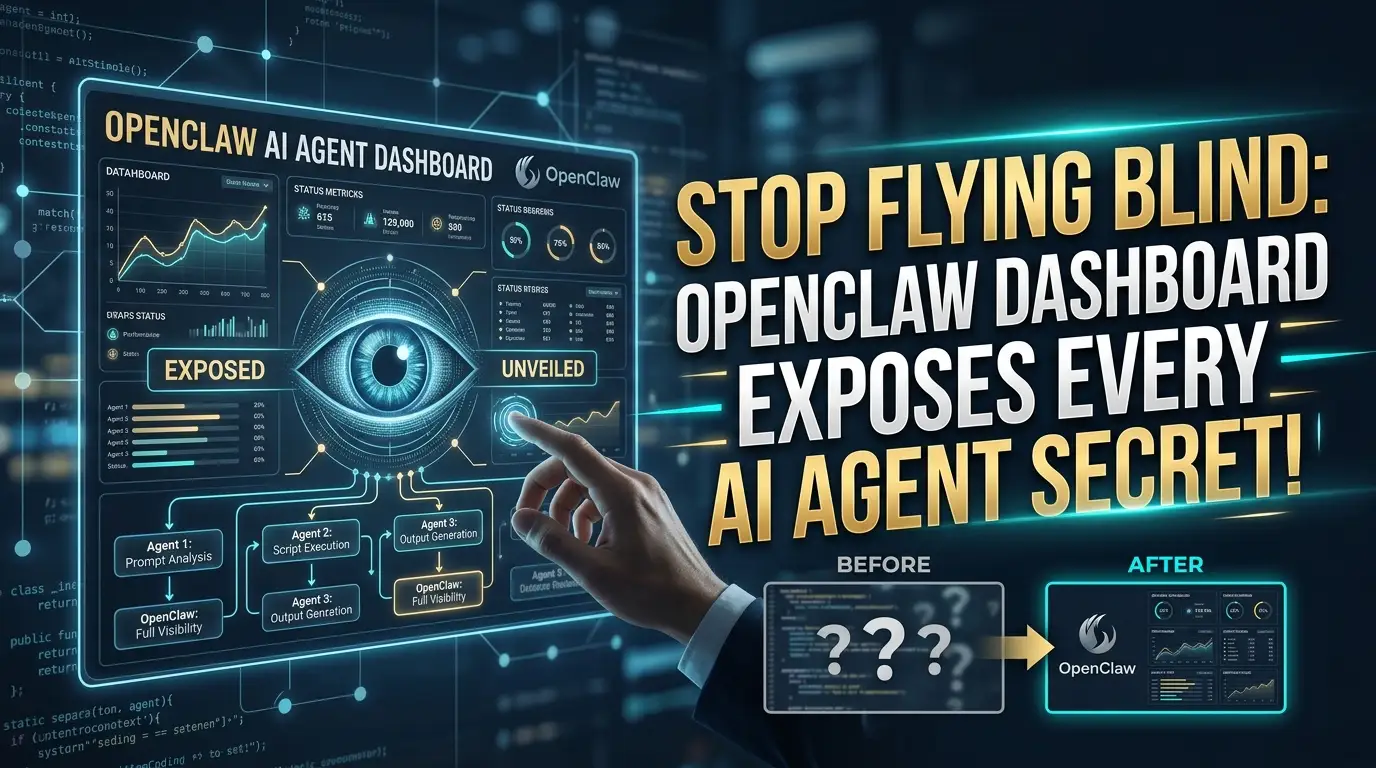
Stop Flying Blind: OpenClaw Dashboard Exposes Every AI Agent Secret
Here's a dirty secret most AI developers won't admit: they have no idea what their agents are actually doing right now. They're burning through API credits like there's no tomorrow, missing critical failures until it's too late, and treating their autonomous systems like mysterious black boxes. Sound familiar?
If you're running OpenClaw agents in production—or even experimenting locally—you're probably guilty of this too. You tail -f some log file, squint at scattered JSON outputs, and pray nothing explodes while you're asleep. But what if you could see everything? What if you had a mission control center for your AI agents that showed real-time sessions, live cost bleeding, memory file browsing, and even system health sparklines—all behind bulletproof authentication?
Enter OpenClaw Dashboard, the open-source monitoring tool that's making developers abandon their janky shell scripts and fragmented observability stacks. Built by Tuğcan Topaloğlu with a security-first philosophy and zero external dependencies, this isn't just another pretty admin panel. It's a complete operational intelligence platform for AI agent workloads.
In this deep dive, I'll walk you through why OpenClaw Dashboard is rapidly becoming the secret weapon of serious AI engineers, how to deploy it in under a minute, and the advanced features that'll make you wonder how you ever managed agents without it. Buckle up—your agent operations are about to get a massive upgrade.
What Is OpenClaw Dashboard?
OpenClaw Dashboard is a secure, real-time monitoring and control interface purpose-built for OpenClaw AI agents. Unlike generic observability tools that force you to retrofit AI-specific metrics into ill-fitting dashboards, this tool speaks the native language of agent operations—sessions, memory files, API rate limits, model costs, and live message streams.
The project emerged from a genuine pain point: OpenClaw agents generate rich operational data (session histories, memory markdown↗ Smart Converter files, cron job schedules, Git activity) but lacked a unified interface to consume it. Tuğcan Topaloğlu solved this by building a pure Node.js application with zero npm dependencies and no database requirements—an architectural choice that screams reliability and minimal attack surface.
What makes this dashboard genuinely trend-worthy is its security-first design in a world of hastily-shipped AI tools. While competitors bolt on auth as an afterthought, OpenClaw Dashboard ships with PBKDF2 password hashing, optional TOTP MFA, HSTS/CSP headers, rate limiting, and audit logging out of the box. The project has attracted attention because it fills a critical gap: AI agent infrastructure that's as professionally hardened as traditional production systems.
The dashboard auto-detects your OpenClaw workspace structure, reads agent memory files (MEMORY.md, HEARTBEAT.md, daily notes), monitors Claude and Gemini API consumption, and even exposes Docker↗ Bright Coding Blog management and system security auditing. It's not just monitoring—it's complete operational control.
Key Features That Demand Your Attention
Let's dissect what makes this dashboard exceptional from a technical operations perspective:
🔐 Enterprise-Grade Security Architecture The authentication system uses PBKDF2 with 100,000 SHA-512 iterations and random salts—identical to standards used in financial applications. Optional TOTP MFA integrates with Google Authenticator, Authy, or any RFC 6238-compatible app. Session management uses server-side memory storage with timing-safe comparisons to prevent side-channel attacks. Rate limiting implements graduated lockouts: 5 failed attempts trigger 15-minute soft lockouts, while 20 failures require service restart.
📊 Real-Time Operational Intelligence A Server-Sent Events (SSE) live feed streams agent messages across all sessions with auto-refresh every 5 seconds. The activity heatmap visualizes peak usage hours over 30 days, while streak tracking gamifies consistent agent operation. Health history maintains 24-hour sparklines for CPU, RAM, temperature, and disk metrics.
💰 Financial Control at Your Fingertips Cost analysis breaks down spending by model (Claude Opus/Sonnet, Gemini Pro/Flash), individual session, and time period. The Claude usage scraper parses actual CLI output via tmux sessions, while Gemini tracking provides per-model breakdowns. Provider switching lets you toggle between Claude and Gemini views on the overview card.
🧠 Native Memory & File Operations
Browse agent memory files directly—MEMORY.md for long-term context, HEARTBEAT.md for task lists, and dated daily notes. The files manager includes path traversal protection, automatic .bak creation before overwrites, and JSON validation for configuration edits.
🛠️ Infrastructure Management Docker container control (start/stop/restart/prune), systemd service management, cron job toggling and manual triggering, Tailscale integration, and a complete security dashboard (UFW rules, fail2ban, SSH logs) round out the operational toolkit.
🎯 Developer Experience Polish
Keyboard shortcuts (1-9 for page navigation, / for search, ? for help), dark/light theme persistence, mobile responsiveness, browser notifications for approaching rate limits, and zero build step required for development.
Use Cases Where OpenClaw Dashboard Dominates
1. Production AI Agent Fleets
Running multiple OpenClaw agents for different clients or departments? The session search and filtering (by status, model, date range with live search) lets you pinpoint exactly which agent is misbehaving. The timeline view visualizes session activity patterns, while cost analysis prevents budget overruns before they happen.
2. Cost-Conscious Development Workflows
Claude API bills can spike violently during debugging loops. The 5-hour rolling window rate limit monitoring and per-model cost breakdowns let you catch runaway spending in real-time. Set browser notifications to alert when you're approaching limits—no more surprise $500 invoices.
3. Security-Hardened Remote Operations
Access your agent infrastructure via Tailscale's encrypted mesh network (100.64.0.0/10 IPs exempt from HTTPS enforcement). The security dashboard audits UFW rules, monitors fail2ban status, and reviews SSH login attempts. MFA protects against credential compromise even if your password leaks.
4. Memory-Driven Agent Debugging
When agents produce unexpected outputs, the memory viewer lets you inspect exactly what context they retained. Browse HEARTBEAT.md for stuck tasks, check daily memory notes for pattern drift, and edit workspace configs directly when you need to adjust behavior—no SSH required.
5. Automated Infrastructure Maintenance
Use cron management to schedule agent restarts, trigger cleanup jobs, or coordinate model switching. The quick actions panel provides one-click system updates, log rotation, and service restarts. Docker management handles container lifecycle without leaving the dashboard.
Step-by-Step Installation & Setup Guide
Prerequisites
- Node.js v18+ (
node --versionto verify) - OpenClaw installed and configured
- Optional:
jq(Docker page),tmux+python3(Claude scraper),docker(container management)
Quick Deploy (60 Seconds)
# Clone the repository
git clone https://github.com/tugcantopaloglu/openclaw-dashboard.git
cd openclaw-dashboard

# Set your OpenClaw workspace path (auto-detects if omitted)
export WORKSPACE_DIR=/path/to/your/openclaw/workspace

# Launch the dashboard
node server.js
Visit http://localhost:7000 and complete first-time registration. Save the recovery token printed at startup—you'll need it for password resets.
Production Systemd Deployment
For auto-start and crash recovery, use the provided installer:
sudo ./install.sh
This creates /etc/systemd/system/agent-dashboard.service with override configuration, enables the service, and generates your recovery token. Monitor logs with:
journalctl -u agent-dashboard -f
Docker Deployment
# Build image
docker build -t openclaw-dashboard .

# Run with Docker management capabilities
docker run -d \
  --name openclaw-dashboard \
  -p 3001:3001 \
  -e WORKSPACE_DIR=/app/workspace \
  -e DASHBOARD_ALLOW_HTTP=true \
  -v ~/.openclaw:/home/node/.openclaw:ro \
  -v ~/.openclaw/workspace:/app/workspace \
  -v /var/run/docker.sock:/var/run/docker.sock:ro \
  --group-add $(stat -c '%g' /var/run/docker.sock) \
  openclaw-dashboard
Environment Configuration
| Variable | Purpose | Default |
|---|---|---|
DASHBOARD_PORT |
Server port | 7000 |
DASHBOARD_TOKEN |
Recovery token for password reset | Auto-generated |
WORKSPACE_DIR |
OpenClaw workspace path | Auto-detected |
OPENCLAW_DIR |
OpenClaw config directory | ~/.openclaw |
OPENCLAW_AGENT |
Agent ID to monitor | main |
DASHBOARD_ALLOW_HTTP |
Allow HTTP from non-local IPs | false |
Critical security note: Only set DASHBOARD_ALLOW_HTTP=true for trusted LAN access. Never expose HTTP to the public internet.
REAL Code Examples from the Repository
Let's examine actual implementation patterns from OpenClaw Dashboard's codebase, demonstrating its architectural decisions and security model.
Example 1: First-Time Registration Flow
The dashboard uses a self-hosted registration model with no external identity providers:
# Clone and enter the project
git clone https://github.com/tugcantopaloglu/openclaw-dashboard.git
cd openclaw-dashboard

# Set workspace if auto-detection fails
export WORKSPACE_DIR=/path/to/your/openclaw/workspace

# Start the server—recovery token prints to stdout
node server.js
What's happening here: The server auto-detects whether credentials exist in data/credentials.json. On first startup, it presents a registration screen rather than a login form. The recovery token is cryptographically random and printed exactly once—if you lose it, you must extract it from systemd overrides or environment variables. This design eliminates dependency on email services or third-party OAuth providers, keeping your agent infrastructure completely self-contained.
Example 2: Password Hashing Implementation
The authentication system uses industry-standard PBKDF2:
// data/credentials.json structure after registration
{
  "username": "admin",
  "passwordHash": "pbkdf2_sha512$100000$...",
  "salt": "...",
  "mfaSecret": "BASE32SECRET..."
}
Security analysis: The 100000 iteration count exceeds OWASP's 2023 minimum recommendation (600,000 for PBKDF2-SHA256 is ideal, but SHA-512 at 100k provides comparable work factor). The random salt prevents rainbow table attacks. Critically, passwords are never transmitted to the browser after registration—only session tokens circulate, mitigating XSS credential theft risks.
Example 3: MFA Reset Procedure (Emergency Access)
When authenticator access is lost, this server-side command clears MFA without compromising the account:
# SSH into your server and execute
node -e "const fs=require('fs');const c=JSON.parse(fs.readFileSync('/root/clawd/data/credentials.json','utf8'));delete c.mfaSecret;fs.writeFileSync('/root/clawd/data/credentials.json',JSON.stringify(c,null,2));console.log('MFA cleared')"

# Restart to apply
systemctl restart agent-dashboard
Why this matters: The reset requires filesystem access—an attacker with only network access cannot bypass MFA. The path /root/clawd/data/credentials.json adjusts to your workspace location. After restart, username/password authentication resumes, and you re-enroll MFA with a fresh QR code. This recovery model balances availability with security.
Example 4: Docker Management with Socket Binding
For container operations, the dashboard reads the Docker socket with proper group permissions:
# Run with Docker socket mounted read-only
docker run -d \
  --name openclaw-dashboard \
  -p 3001:3001 \
  -e WORKSPACE_DIR=/app/workspace \
  -e DASHBOARD_ALLOW_HTTP=true \
  -v ~/.openclaw:/home/node/.openclaw:ro \
  -v ~/.openclaw/workspace:/app/workspace \
  -v /var/run/docker.sock:/var/run/docker.sock:ro \
  --group-add $(stat -c '%g' /var/run/docker.sock) \
  openclaw-dashboard
Container security: The socket is mounted read-only (:ro) and the container joins the Docker group dynamically via --group-add $(stat -c '%g' /var/run/docker.sock). This avoids running the dashboard as root while maintaining container management capabilities. The DASHBOARD_ALLOW_HTTP=true is acceptable here because Docker networks are internal—never use this flag for public-facing deployments.
Example 5: API Health Check for Monitoring Integration
Integrate the dashboard into your existing observability stack:
# Verify dashboard availability and auth state
curl http://localhost:7000/api/auth/status
Expected response for healthy, unauthenticated state:
{"authenticated": false, "requiresRegistration": false}
Operational pattern: This endpoint enables load balancer health checks and monitoring probes without triggering authentication flows. The requiresRegistration flag distinguishes between "needs login" and "needs setup" states—critical for automated deployment validation.
Advanced Usage & Best Practices
🔒 Network Architecture: Always deploy behind Tailscale for encrypted remote access. The dashboard automatically exempts Tailscale IPs (100.64.0.0/10) from HTTPS enforcement, leveraging MagicDNS for seamless TLS. For multi-user teams, consider a reverse proxy with client certificate authentication rather than exposing the dashboard directly.
📈 Cost Optimization: Schedule the Claude usage scraper (scripts/scrape-claude-usage.sh) via cron to run hourly, not continuously—tmux sessions consume resources. Use the per-model selector to identify which Claude model (Opus vs. Sonnet) or Gemini variant (Pro vs. Flash) dominates your spending, then adjust agent configurations accordingly.
🧠 Memory Hygiene: The memory viewer reveals when agents accumulate stale context. Implement a cron job to archive daily notes older than 30 days, preventing MEMORY.md bloat that degrades agent performance. Use the config editor's JSON validation to catch syntax errors before they crash your agent gateway.
🛡️ Security Hardening: Enable MFA immediately after registration—don't wait. Review data/audit.log weekly for anomalous authentication patterns. The security dashboard's fail2ban integration shows blocked IPs; correlate these with your SSH logs for attack pattern analysis.
⚡ Performance Tuning: The 5-second auto-refresh interval suits most deployments, but high-frequency trading agents might need adjustments. Modify the SSE stream in server.js if you're handling 100+ concurrent sessions—the pure Node.js architecture makes this trivial without dependency conflicts.
Comparison with Alternatives
| Feature | OpenClaw Dashboard | Generic Monitoring (Grafana) | Cloud AI Platforms | Custom Scripts |
|---|---|---|---|---|
| OpenClaw Native | ✅ Deep integration | ❌ Requires custom exporters | ❌ Vendor lock-in | ⚠️ Fragile parsing |
| Zero Dependencies | ✅ Pure Node.js | ❌ Multiple services | ❌ SaaS subscription | ⚠️ Variable |
| MFA Authentication | ✅ TOTP built-in | ❌ External auth required | ✅ Usually | ❌ Rarely |
| Memory File Browsing | ✅ Native viewer | ❌ Not applicable | ❌ Black box | ⚠️ Manual cat |
| Cost Tracking by Model | ✅ Claude + Gemini | ❌ Generic metrics | ✅ Limited | ❌ Manual calculation |
| Docker Management | ✅ Integrated | ❌ Separate plugin | ❌ Not applicable | ⚠️ docker CLI |
| Offline Operation | ✅ Fully self-hosted | ⚠️ Partial | ❌ Cloud-dependent | ✅ Yes |
| Setup Complexity | 🟢 Single command | 🟡 Multi-service stack | 🟢 SaaS signup | 🔴 High maintenance |
Verdict: OpenClaw Dashboard wins where operational sovereignty matters—when you need complete data control, zero recurring costs, and native understanding of agent semantics. Grafana excels for generic infrastructure but forces you to build custom exporters for agent-specific metrics. Cloud platforms sacrifice transparency for convenience. Custom scripts inevitably rot as APIs evolve.
FAQ
Q: Is OpenClaw Dashboard free for commercial use? A: Yes—MIT licensed. Deploy internally, modify freely, no attribution required beyond the license file. Perfect for agencies running client agent infrastructures.
Q: Can I monitor multiple OpenClaw agents simultaneously?
A: The OPENCLAW_AGENT environment variable targets one agent ID (default: main), but you can run multiple dashboard instances on different ports, each pointed at a different agent workspace.
Q: What happens if I lose both my password and recovery token?
A: SSH to the server and delete data/credentials.json—the registration screen reappears on next visit. Your memory files and audit logs survive; only auth credentials reset.
Q: Does the dashboard work without OpenClaw installed? A: Partially. Core features (auth, system health, Docker management) function independently, but agent-specific views (sessions, memory files, usage scraping) require an active OpenClaw workspace structure.
Q: How does the live feed handle high message volumes? A: Server-Sent Events with automatic reconnection. The client-side implements backpressure through browser event loop scheduling—no message drops under normal loads, though extreme bursts may batch updates.
Q: Is my API usage data sent anywhere externally? A: Never. Claude and Gemini usage scraping happens locally via your own scripts. No telemetry, no analytics, no external dependencies. The "minimal dependencies" philosophy extends to data privacy.
Q: Can I contribute features back to the project?
A: Absolutely. The development setup requires zero build steps—edit server.js or index.html and reload. The maintainer welcomes PRs following the existing code style (self-documenting, no comments, brief function names).
Conclusion
OpenClaw Dashboard solves a problem most AI developers pretend doesn't exist: the operational blindness of running autonomous agents at scale. It transforms chaotic log tailing, scattered cost tracking, and manual memory file hunting into a unified, secure command center.
What impresses me most isn't any single feature—it's the architectural coherence. Zero npm dependencies means zero supply chain attack surface. PBKDF2 + TOTP MFA in a side project shows genuine security commitment, not checkbox compliance. The auto-detection of OpenClaw workspace structures demonstrates deep domain understanding that generic tools can't replicate.
If you're serious about AI agent operations—not just prototyping, but running reliable, observable, cost-controlled systems—this dashboard belongs in your infrastructure. The 60-second deployment belies its production readiness.
👉 Star OpenClaw Dashboard on GitHub, deploy it this afternoon, and finally see what your agents have been hiding. Your future self—reviewing clean cost breakdowns instead of deciphering crash logs—will thank you.
Found this breakdown valuable? Share it with your agent-ops team and follow Tuğcan Topaloğlu for updates.